Using Instruments to find code leaks
As we are working much more in the polish and optimization stage rather than implementing new features at the moment I have had some time to look at our overall memory footprint and look into some niggling worries i have had about some of the features I have implemented at different stages. One of the major worries for me has been the performance of the path finding. We use a fairly simple A* algorithm for our path finding an i wrote it about two years ago when we were first prototyping a tower defense game. I haven’t really had to look at it much since as it has just done its job.
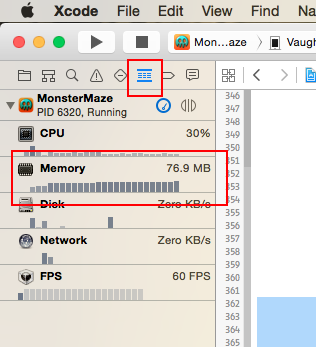
While testing one of the later levels I noticed that the memory didn’t drop back to the same level when going from the main menu into a level and back out again. XCode has some very basic memory and CPU information that is useful for an initial view.
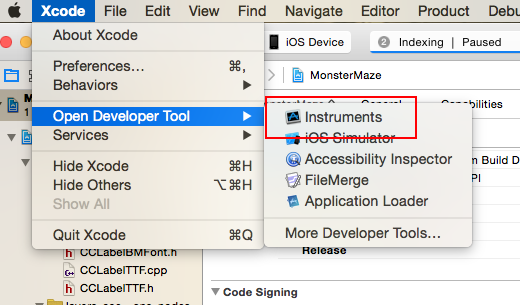
While I suspected it was the path finding it is always best to prove problems first so you can really tell if you have fixed them, so it was time to fire up Instruments which is a handy tool for profiling your apps that xcode provides.
Today I was only really worried about memory allocations so I selected Allocations and attached it to a debug build of our game. The best information for what I was looking for is the allocation call trees which shows where allocations are being called from and some stats around how often and how much memory each specific call using.
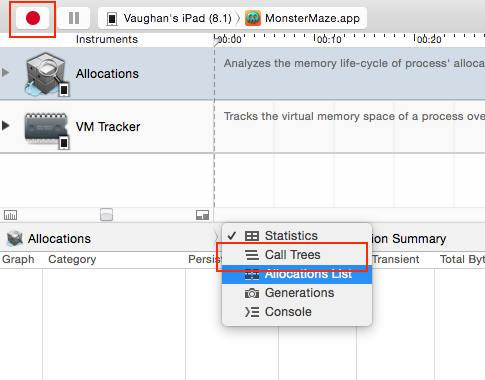
I hit the record button played through a level and returned to the main menu which is where i expected all the levels memory to have been released.
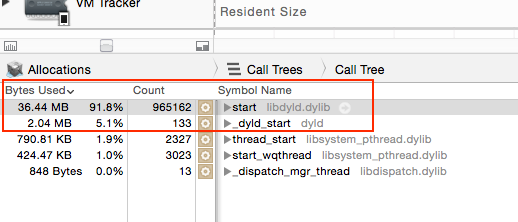
Starting at the top I drilled down till I found the first culprit, which was a new allocation within the PathBlackboard::FindBestPath method.
![]()
You can select the function and it will open up at the line of code showing the allocation then all that was needed was to debug my code to figure out why the memory was not getting deleted. Turned out in this case that while i was cleaning up the best path that the function found i was not cleaning up the extra nodes that it had found and discarded.
After fixing this issue it was just a matter of repeating the above process to find any other smaller leaks and now our levels start up and close without leaving large pieces of memory dangling around.
As an extra benefit having to go back into this code gave me a fresh look over it and the next task with the path finding is to benchmark its performance and then optimize it as there it is a very naive implementation, but that’s a job for another day and another post.